This is a mini post part of this project. (Originally posted here ).
Take a quick look at time of day distribution#
import matplotlib.pyplot as plt
import numpy as np
import pandas as pd
datadir = '/opt/data'
localdir = '/opt/program'
tripsdf = pd.read_csv(f'{datadir}/2013-07 - Citi Bike trip data.csv')
stationsdf = pd.read_csv(f'{localdir}/datas/stations/stations-2018-12-04-c.csv',
                        index_col=0)
tripduration                               634
starttime                  2013-07-01 00:00:00
stoptime                   2013-07-01 00:10:34
start station id                           164
start station name             E 47 St & 2 Ave
start station latitude                 40.7532
start station longitude               -73.9703
end station id                             504
end station name               1 Ave & E 15 St
end station latitude                   40.7322
end station longitude                 -73.9817
bikeid                                   16950
usertype                              Customer
birth year                                  \N
gender                                       0
Name: 0, dtype: object
tripsdf['starttime'].map(lambda x: x[11:13]).iloc[:10]
0    00
1    00
2    00
3    00
4    00
5    00
6    00
7    00
8    00
9    00
Name: starttime, dtype: object
tripsdf['hour'] = tripsdf['starttime'].map(lambda x: x[11:13])
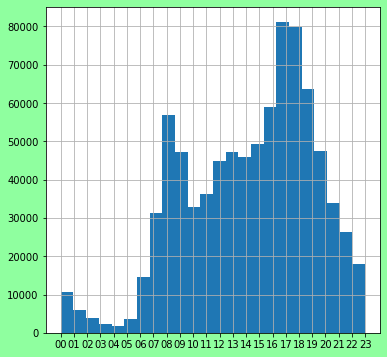
# For all time looks like maybe two peaks

fig = plt.figure(figsize=(6, 6))
fig.patch.set_facecolor('xkcd:mint green')
ax = fig.add_subplot(111, )

ax.hist(tripsdf.hour.tolist(), bins=24)
plt.grid(True)
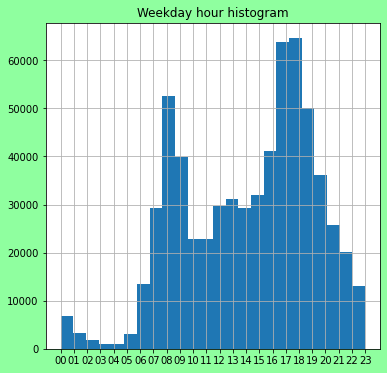
# Perhaps on weekdays different?
import fresh.utils as fu

fu.prepare_weekday_feature(tripsdf)
fig = plt.figure(figsize=(6, 6))
fig.patch.set_facecolor('xkcd:mint green')
ax = fig.add_subplot(111, )
ax.hist(tripsdf[tripsdf.weekday == True].hour.tolist(), bins=24)
ax.set_title('Weekday hour histogram')
plt.grid(True)
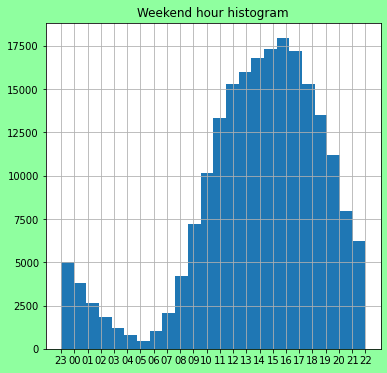
# Weekend wow big difference.
fig = plt.figure(figsize=(6, 6))
fig.patch.set_facecolor('xkcd:mint green')
ax = fig.add_subplot(111, )
ax.hist(tripsdf[tripsdf.weekday == False].hour.tolist(), bins=24)
ax.set_title('Weekend hour histogram')
plt.grid(True)
# Ok based on the above, going to create a version 2...
# time_of_day_v2_peaky
# Not sure how to account for the different peaks on weekends
#     # 0: 6-10, 1: 11-15, 2: 16-20, 3: 21-00, 00-5
Age#
- Somehow I did not include age this time around but I should.
tripsdf[['usertype', 'birth year']].iloc[:5]
| usertype | birth year |
|---|
| 0 | Customer | \N |
|---|
| 1 | Customer | \N |
|---|
| 2 | Subscriber | 1980 |
|---|
| 3 | Customer | \N |
|---|
| 4 | Subscriber | 1986 |
|---|
# Ok should basically fill these as np.nan for 'Customer'
dict(tripsdf[tripsdf.usertype=='Customer']['birth year'].value_counts())
{'\\N': 174887, '1995': 28}
# Luckily no nulls
tripsdf[(tripsdf.usertype=='Subscriber')& (tripsdf['birth year'].isnull())].shape
(0, 18)
def make_xtick_labels(x, step=5):
    '''Given x, step the labels every <step>
    Aka, take every <step>th x label
    '''
    x_ticks = [i for i in  range(len(x)) if i % step == 0]
    x_labels = [x[i] for i in x_ticks]
    return x_ticks, x_labels
tripsdf['birth year'] = tripsdf['birth year'].map(lambda x:int(x) if x != '\\N' else np.nan )
# Discard below 1913 as np.nan. TODO
tripsdf[(tripsdf.usertype=='Subscriber')& (tripsdf['birth year'] < 1913)].shape
(226, 18)
X = [x for x in tripsdf[(tripsdf.usertype == 'Subscriber')]['birth year'].tolist()
    if x > 1913]
print(len(X))
fig = plt.figure(figsize=(12, 6))
fig.patch.set_facecolor('xkcd:mint green')
ax = fig.add_subplot(111, )

ax.hist(X[:10000], bins=70)

# x_ticks, x_labels = make_xtick_labels(x[:1000], step=20)
# ax.set_xticks(x_ticks)
# ax.set_xticklabels(x_labels, rotation=-45)

ax.set_title('Birth year binned (2013-07)')
plt.grid(True)
fig.show()
668262
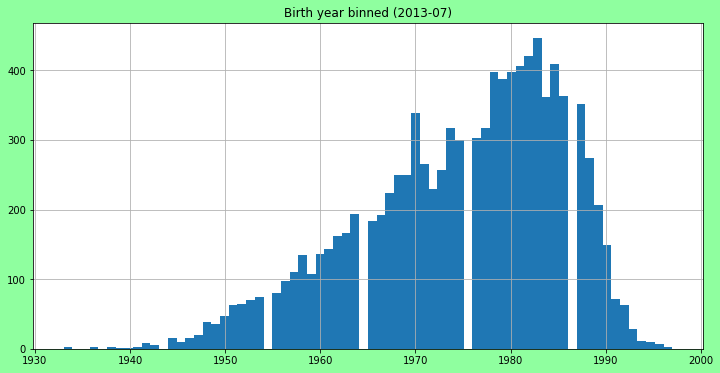
# Ok this seems normal ish. so might as well just split somewhat arbitrarily or evenly

def get_quantiles(unsorted):
    data = sorted(unsorted)
    minimum = data[0]
    Q1 = np.percentile(data, 25, interpolation = 'midpoint')
    median = np.median(data)
    Q3 = np.percentile(data, 75, interpolation = 'midpoint')
    maximum = data[-1]
    return [minimum, Q1, median, Q3, maximum]
def show_da_stats(bundle):
    H, bins = bundle['hist']
    quantiles = bundle['quantiles']
    fig = plt.figure(figsize=(12, 6))
    fig.patch.set_facecolor('xkcd:mint green')
    ax = fig.add_subplot(111, )
    ax.scatter(quantiles, [1, 1, 1, 1, 1])
    ax.axvline(quantiles[1], label='q:25%')
    ax.axvline(quantiles[2], label='q:50%')
    ax.axvline(quantiles[3], label='q:75%')

    ax.set_title(bundle['title'])
    ax.plot(bins, np.insert(H, 0, H[0]), drawstyle='steps', color='green')
    plt.grid(True)
    fig.legend()
    fig.show()

#
hist = np.histogram(X, bins=100, range=None)

quantiles = get_quantiles(X)
bundle = {'hist': hist, 'quantiles': quantiles,
               'title': 'Birth year binned (2013-07)'}
print('quantiles', quantiles)
show_da_stats(bundle)
quantiles [1920.0, 1969.0, 1978.0, 1984.0, 1997.0]
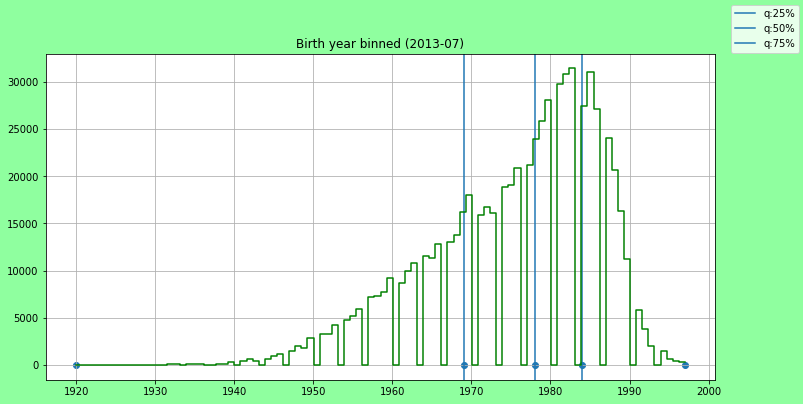
# And the age quantiles to make this a year independent feature..
2013 - np.array([1920.0, 1969.0, 1978.0, 1984.0, 1997.0])
array([93., 44., 35., 29., 16.])
import datetime; import pytz
x = dict(tripsdf.iloc[2])
x

(x['start_dt'] -
     datetime.datetime(int(x['birth year']), 1, 1, tzinfo=pytz.timezone('US/Eastern'))
).days/365. , (x['start_dt'] - np.nan)
---------------------------------------------------------------------------

TypeError                                 Traceback (most recent call last)

<ipython-input-102-ee3bddc50852> in <module>
      5 (x['start_dt'] -
      6      datetime.datetime(int(x['birth year']), 1, 1, tzinfo=pytz.timezone('US/Eastern'))
----> 7 ).days/365. , (x['start_dt'] - np.nan)


TypeError: unsupported operand type(s) for -: 'Timestamp' and 'float'
NaT
# Reload once again since I modified a col
tripsdf = pd.read_csv(f'{datadir}/2013-07 - Citi Bike trip data.csv')
reload(fu)
minidf = tripsdf.iloc[:1000].copy()
fu.prepare_weekday_feature(minidf)
fu.age_feature(minidf)
list(reversed([93., 44., 35., 29., 16.]))
[16.0, 29.0, 35.0, 44.0, 93.0]
minidf['birth_bin'] = pd.cut(minidf['age'], bins=[16.0, 29.0, 35.0, 44.0, 93.0],
                            labels=[0, 1, 2, 3])
minidf[['age', 'birth', 'birth_bin']].iloc[:10]
| age | birth | birth_bin |
|---|
| 0 | NaN | NaT | NaN |
|---|
| 1 | NaN | NaT | NaN |
|---|
| 2 | 33.520548 | 1979-12-31 23:56:00-05:00 | 1 |
|---|
| 3 | NaN | NaT | NaN |
|---|
| 4 | 27.515068 | 1985-12-31 23:56:00-05:00 | 0 |
|---|
| 5 | 25.515068 | 1987-12-31 23:56:00-05:00 | 0 |
|---|
| 6 | NaN | NaT | NaN |
|---|
| 7 | 28.515068 | 1984-12-31 23:56:00-05:00 | 0 |
|---|
| 8 | 33.520548 | 1979-12-31 23:56:00-05:00 | 1 |
|---|
| 9 | 24.512329 | 1988-12-31 23:56:00-05:00 | 0 |
|---|
Prepare to build the v3 proc bundle#
- I have a nice reference for testing
- And for building, I need to do some reverse engineering to maintain the train/test split from earlier.
import fresh.predict_utils as fpu

bundle = fpu.load_bundle_in_docker()
Loading from bundle_loc /opt/ml/model/all_bundle_with_stationsdf.joblib
print('original proc bundle notebook', bundle['proc_bundle']['bundle']['notebook'])
bundle['proc_bundle']['bundle']['proc_bundle'].keys()
print('this is the bundle glue notebook, cool', bundle['notebook'])
print('model notebook', bundle['model_bundle']['bundle']['notebook'])
print('train', bundle['model_bundle']['bundle']['train'])
print('test', bundle['model_bundle']['bundle']['validation_metrics']['test'])
original proc bundle notebook 2020-07-03-aws.ipynb
this is the bundle glue notebook, cool 2020-08-18-glue.ipynb
model notebook 2020-07-10-aws.ipynb
train /home/ec2-user/SageMaker/learn-citibike/artifacts/2020-07-08T143732Z/train.libsvm
test /home/ec2-user/SageMaker/learn-citibike/artifacts/2020-07-08T143732Z/test.libsvm
import fresh.preproc.v3 as pv3